comparing some statistics riders vs. testers @ Low-Key Portola Valley
This is yet another in a series of the Low-Key Hillclimbs Portola Valley Hills multi-climb day. We used GPS to time riders based on when they were interpolated to have crossed a series of "lines" (essentially passing through virtual pylons) in the correct direction. Between certain lines there was a time budget which was designed to be easy to meet, as long as you didn't dally. The lines were designed to be wide enough so all riders who rode the course would be credited with crossing all of the lines, even in the presence of GPS errors.
It all worked so well in testing. But in practice, on "game day", the conclusions from testing proved optimistic.
First I'll look at time budgets. I had provided a lot of slack in these, and I needed it. There's two major reasons for this. One is that the test riders were mostly solo. On the other hand the "event" riders tended to ride in groups. With group rides the faster riders would wait at the top of climbs for slower riders. This added time to all but the slowest climbers in the group.
Another reason is the riders knew what their time budget was. Since they wanted to recover to produce a good result on the following climb, they likely rode at a slow enough pace to use a reasonably large fraction of the time budget.
Here's a plot shoing that: I plot the fraction of the time budgets taken by the testers for each checkpoint superposed on the fraction of time taken by the event-day riders. You can see the testers tend to fall at the lower range of the distributions. Indeed, at checkpoint 10 I had to increase the time limit from 10 minutes to 15 minutes.

Checkpoint 4 is Joaquin, which I neutralized by assigning a large time budget. Curiously the time budget I was initially most worried about, the long grind to checkpoint 3, was the least issue. The long spin to Summit Spring was an issue for one rider who stopped for around 16 minutes in addition to taking a longer than recommended path. I hadn't thought that transfer was going to be an issue.
Then I looked at the line crossings. I earlier showed that with my initial line definitions the test riders used only 1/3 of the total line width. Well, that turned out to be optimistic. In the actual event I had to considerably widen several lines, in particular on Golden Oak and on Summit Spring, but also at the top of Golden Oak East for one outlier activity. Here's a histogram of the line crossing parameters for the test riders (using the new lines) plotted along with the same statistics for the riders on Saturday.
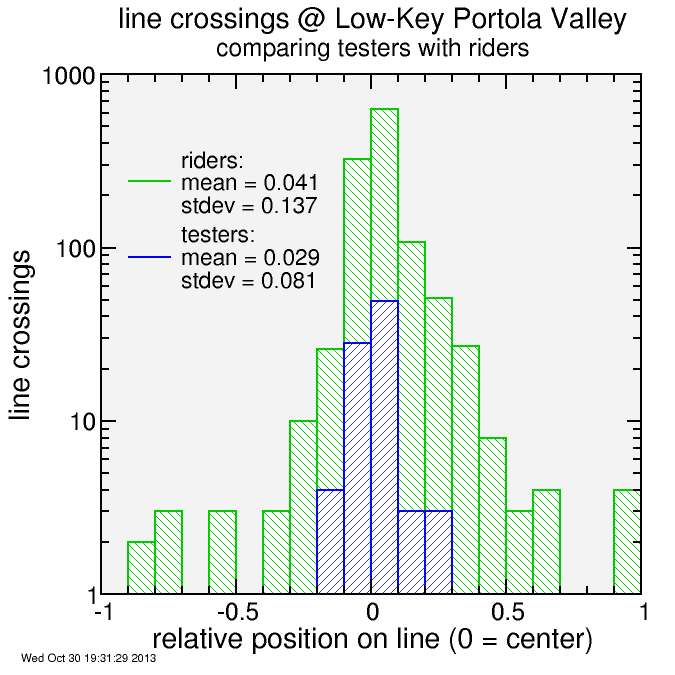
The statistics are shown in the legend. The standard deviation for ride-day was substantially larger than the standard deviation for the test riders. Standard deviation represents the spread in points under the assumption points are normally distributed (characterized by a Gaussian probability function). However, the "ride day" curve deviates from a Gaussian shape. There are a significant number of non-normal outliers, with errors which extend considerably beyond the Gaussian core. The Gaussian portion itself is similar between the testers and the Saturday riders. The outliers are what are responsible for the increased standard deviation int he statistics.
The test should be whether a certain bike computer is responsible for a disproportionate fraction of the outliers. I wanted to test this but my first attempt at HTML scraping failed because of Strava's restriction of that information to clients who have logged in, and my Perl script did not log in. And it's not provided to via their API.
In any case, the message is clear: it's important to test with a broad range of testers. My testing, which led to the conclusion the course was robust, was optimistic.


Comments